[Author’s note: Daniel Ferry, an Excel MVP, recently updated the Excel 2010 gradebook template. Now you can easily print all student reports with the click of one button. This new button required VBA script, which creates macros in the file. You’ll want to click Enable Macros when prompted during download. These macros have been tested and validated by Microsoft.]
Earlier in the year I worked with Beth Melton, an Excel Microsoft Most Valuable Professional (MVP), to create a super easy and visual gradebook template in Excel 2010. It’s built for teachers with little to no Microsoft Excel experience. In fact, all of the grade calculation formulas are taken care of for you. We built the template in Excel 2010, because of all the new 2010 data visualization features. It even includes a printable student progress report!
1. Open Excel 2010.
2. Click the File tab.
3. Click New.
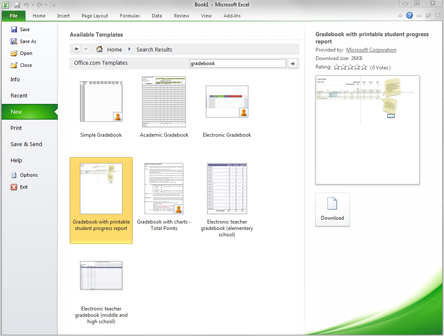
4. In the Office.com Templates search box, type gradebook and then click the search (magnifying glass) button.
5. Click the Gradebook with printable student progress report template.
6. In the information pane, click Download. The template will open as a new Excel spreadsheet.
7. Click File and then click Save As to save a local copy of this file.
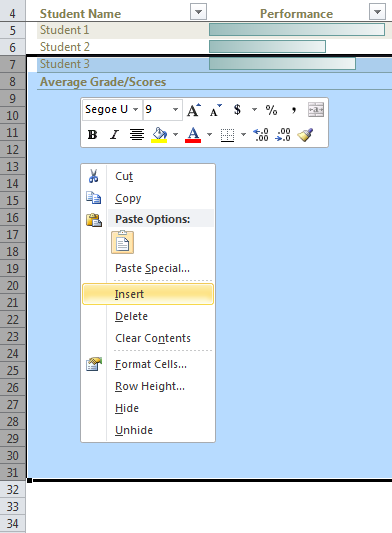
After downloading the template, you’ll see three rows of student names, three columns with assignment names and grades, and some helpful tips in light brown callouts. We added the placeholder data to the template to help you see what it should look like. For example, in the screenshot below notice how the letter grade and percentage is calculated based on the total points possible and the individual student’s total points earned.
To customize the template, you’ll need to:
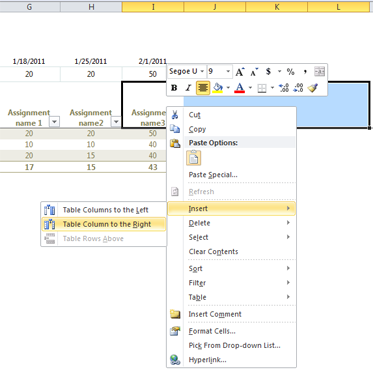
Important: Each assignment has a matching entry in the Total Possible Points table.You must keep data in at least one student name row, one assignment name column, and one Total Possible Points cell populated with data to preserve existing formulas.
To manually calculate a student’s grade percentage, do the following:
Note: All students who have manual grade percentage calculation will have an error indicator (green triangle) in the top left corner of the cell. It’s a good idea to leave the error indicator as a visual confirmation of the change. Note that the error indicator will not print.
1. From the Student Summary workbook, click cell B8 and use the drop-down arrow to select a student’s name. The bar graph will update with that student’s grade data.

2. Click the File tab on the ribbon.
3. Select the Print tab, and then click the Print button.
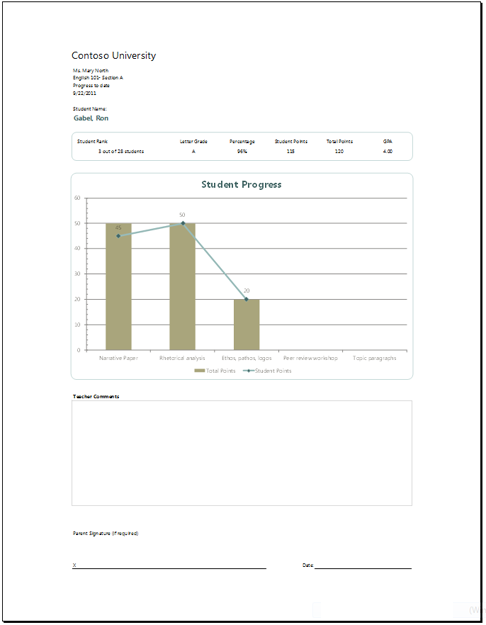
If you want to quickly print a report for every student in your gradebook, open the Student Summary worksheet. In the Student Summary worksheet, click Print All.

I hope this gradebook template saves you time. Have a great 2011- 2012 school year, teachers!
–Jennifer Bost
Help people and teams do their best work with the apps and experiences they rely on every day to connect, collaborate, and get work done from anywhere.